Filter
RSS

Blog posts of '2024' 'March'

Technical Analysis of JKLAKSHMI & JINDALSTEL

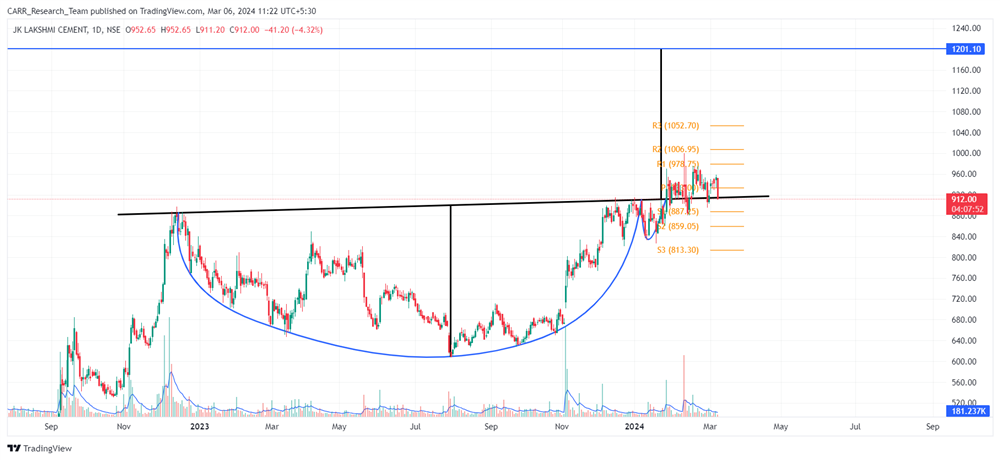
Stock name: JK Lakshmi Cement Ltd.

Pattern: Cup and handle pattern and retest

Time frame: Daily

Observation:

Between December 2022 and January 2024, the stock exhibited a cup and handle pattern on its daily chart. A notable breakout occurred on January 25, 2024, marked by significant trading volume and a positive MACD indicator. Subsequently, the stock underwent a substantial retest of the breakout levels. Presently, the stock's RSI level hovers just below 50. Technical analysis suggests that a rebound from the retest may propel the stock in an upward direction.

You may add this to your watch list to understand further price action.

Disclaimer: This analysis is purely for educational purpose and does not contain any recommendation. Please consult your financial advisor before taking any financial decision.

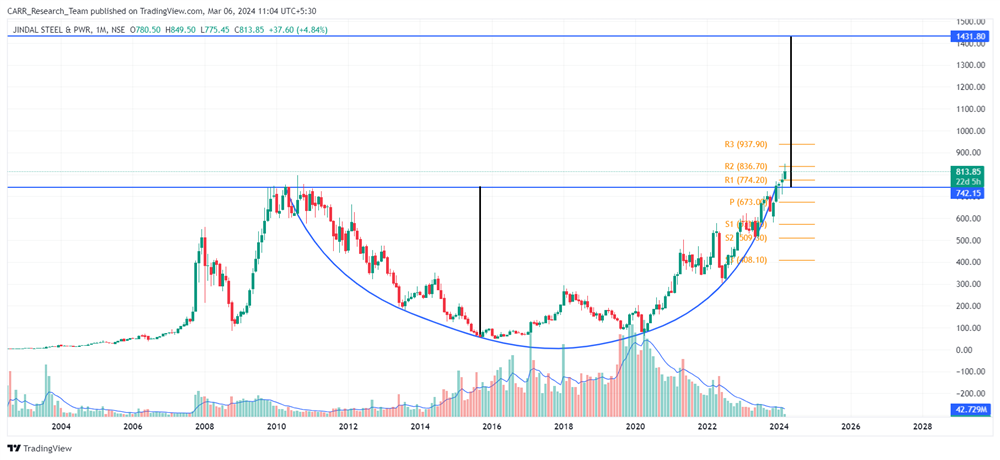
Stock name: Jindal Steel & Power Ltd.

Pattern: Rounding bottom pattern

Time frame: Monthly

Observation:

Since 2010, the stock experienced a decline, but from September 2015 onwards, it initiated a recovery, moving upward. Recently, it reached its 2010 levels and formed a rounding bottom pattern on the monthly chart from April 2010 to December 2023. December 2023 witnessed a breakout from this pattern. Post breakout the stock has continued its upward movement. According to technical analysis, maintaining the current momentum may propel the stock further upward.

You may add this to your watch list to understand further price action.

Disclaimer: This analysis is purely for educational purpose and does not contain any recommendation. Please consult your financial advisor before taking any financial decision.


News for the day:

  • Zomato shares dipped 3.6% on BSE after Ant Financial, an Alibaba affiliate, sold a 2% stake at a 5% discount in a block deal worth over Rs 3,000 crore. This move led to a CLSA target price revision. Zomato reported a quarterly net profit of Rs 138 crore, showing a 69% increase in revenue. Ant Financial held a 6.32% stake in Zomato as of December, making the recent sell-off a notable development.

  • RBI has prohibited JM Financial Products from engaging in share and bond funding, citing regulatory lapses and governance violations. The directive includes a halt to financing against shares and debentures, including loans against IPOs and subscription to debentures. Despite the regulator's claims, JM Financial Products has refuted allegations of lapses and violations. The Reserve Bank of India's stern letter on Tuesday emphasized the immediate cessation of such financial activities by the company.

  • The Reserve Bank of India (RBI) has imposed immediate restrictions on IIFL Finance, preventing the disbursal of gold loans. Following this announcement, IIFL Finance's shares were locked in a 20% lower circuit. The RBI's directive prohibits the company from issuing new gold loans or disbursing funds against existing ones. This development has significantly impacted IIFL Finance's market performance, prompting a notable decrease in its share value.
Technical Analysis of JKLAKSHMI & JINDALSTEL
Read More
Technical Analysis of CERA & PCBL

Stock name: Cera Sanitaryware Ltd.

Pattern: Head and shoulders pattern

Time frame: Weekly

Observation:

The stock has generally exhibited a positive trend, but between May 2023 and February 2024, it formed a head and shoulder pattern on the weekly chart. In February 2024, there was a breakout from this pattern, accompanied by higher-than-average trading volume. Subsequently, the stock experienced a downward movement. Presently, the stock's RSI is at low levels. Based on technical analysis, the stock might continue its downward trajectory if the current momentum is sustained.

You may add this to your watch list to understand further price action.

Disclaimer: This analysis is purely for educational purpose and does not contain any recommendation. Please consult your financial advisor before taking any financial decision.

Stock name: PCBL Ltd.

Pattern: Double top pattern

Time frame: Daily

Observation:

Post covid pandemic, the stock has consistently shown an upward trajectory. However, between January and February 2024, a double top pattern emerged on its daily chart. A breakout from this pattern occurred with above-average trading volume. Following the breakout, the stock underwent a successful retest and is presently moving downward. Additionally, the stock's RSI levels are currently low. Technical analysis suggests that the stock may continue its descent if the existing momentum persists.

You may add this to your watch list to understand further price action.

Disclaimer: This analysis is purely for educational purpose and does not contain any recommendation. Please consult your financial advisor before taking any financial decision.


News for the day:

  • The RBI has approved the merger of Fincare Small Finance Bank with AU Small Finance Bank, marking the first-ever such merger in the small finance banking sector. Shareholders of Fincare will receive 579 equity shares of AU for every 2,000 shares held. This move grants AU a strategic foothold in southern India and entry into microfinance, resulting in a combined network of 2,334 branches.

  • Tata Motors has announced its decision to split into two listed entities, separating its commercial vehicle business and related investments from the passenger vehicle business, which includes Jaguar Land Rover (JLR), electric vehicles, and associated investments. The split is based on the recognition of limited synergies between the two segments, with each entity poised to operate independently.

  • Bharat Heavy Electricals (Bhel) shares surged 12.4% on news of a potential ₹17,000 crore thermal plant order, the largest single-day gain since May 2021. Bhel clarified it has not yet received the order from NTPC. Bhel is the sole bidder for the NTPC tender submitted on December 21, 2023.
Technical Analysis of CERA & PCBL
Read More
Technical Analysis of LALPATHLAB & JUSTDIAL

Stock name: Dr. Lal Path Labs Ltd.

Pattern: Head and shoulders pattern

Time frame: Daily

Observation:

Since March 2023, the stock displayed an upward trend. From September 2023 to February 2024, it stabilized and formed a head and shoulder pattern on the daily chart. The breakout from this pattern occurred on February 27, 2024, with above-average trading volume and a bearish MACD indicator. Following the breakout, the stock has been moving downward, accompanied by low RSI levels. Technical analysis suggests that if the current momentum persists, the stock may continue its downward trajectory.

You may add this to your watch list to understand further price action.

Disclaimer: This analysis is purely for educational purpose and does not contain any recommendation. Please consult your financial advisor before taking any financial decision.

Stock name: Justdial Ltd.

Pattern: Cup and handle pattern

Time frame: Daily

Observation:

Sustaining its upward trend, the stock formed a cup and handle pattern from July 2023 to February 2024. A breakout from this pattern occurred on February 23, 2024, backed by above-average trading volume. Following the breakout, the stock underwent a substantial retest of the breakout level and currently it is still hovering slightly above it. According to technical analysis, a successful rebound from the retest may indicate further upward movement for the stock.

You may add this to your watch list to understand further price action.

Disclaimer: This analysis is purely for educational purpose and does not contain any recommendation. Please consult your financial advisor before taking any financial decision.


News for the day:

  • Aditya Birla Group has received approval from the National Company Law Tribunal (NCLT) to merge several of its non-banking finance companies (NBFCs) as part of a consolidation plan. The move aims to enhance synergies, optimize resource utilization, and achieve greater economies of scale. The Mumbai bench of the NCLT has recently greenlit the merger of six Birla group entities, including Umang Commercial Company Pvt Ltd and Aditya Birla Online Fashion Pvt Ltd, into Birla Group Holdings Pvt Ltd (BGHPL), a pivotal holding company within the conglomerate.

  • In February, TVS Motor Company experienced a robust sales performance, witnessing a 33% YoY increase in wholesales to 368,424 units, compared to 276,150 units in the same period last year. Total two-wheeler sales exhibited a growth of 34%, reaching 357,810 units from 267,026 units in February 2023. Furthermore, the company reported a 16% rise in electric vehicle sales, reaching 17,959 units in February compared to 15,522 units in the corresponding month of the previous year.

  • Signature Global has successfully sold 1,008 luxury flats in Gurugram for over Rs 3,600 crore, reflecting strong demand despite price increases. The new housing project, 'DE LUXE-DXP,' received 5,400 Expressions of Interest, with 35% of units booked by Non-Resident Indians and senior corporate executives. The company's sales bookings for the fiscal year are now projected to surpass Rs 7,200 crore, exceeding initial estimates of Rs 4,500 crore.
Technical Analysis of LALPATHLAB & JUSTDIAL
Read More
What is MACD..?

With the increasing participation in the stock market, we are constantly in need of tools and indicators to help them make informed decisions. One such tool that is recognised to be significant popularity and useful among traders is the MACD. This versatile tool, developed in the late 1970s, continues to be a mainstay for traders seeking to understand price trends and identify potential entry and exit points. But what exactly is the MACD, and how can you leverage its insights for informed trading decisions?

Decoding the MACD Calculation:

The MACD isn't a single line but rather a combination of three components:

  • MACD Line: This represents the difference between two exponential moving averages (EMAs) of the closing price. Typically, a 12-period EMA and a 26-period EMA are used.
  • Signal Line: This is a 9-period EMA of the MACD line itself, acting as a smoother filter for identifying potential trend changes.
  • MACD Histogram: This visualizes the difference between the MACD line and the signal line, offering insights into momentum.

Interpreting MACD Signals

While the calculation might seem complex, the interpretation boils down to observing key interactions:

  • Crossovers: When the MACD line crosses above the signal line, it's often interpreted as a bullish signal, suggesting potential upward momentum. Conversely, a downward crossover might indicate a bearish trend.
  • Divergence: When the price movement diverges from the direction of the MACD, it can signal a potential reversal. Bullish divergence occurs when price dips but the MACD rises, suggesting buying pressure. Bearish divergence happens when price rises but the MACD falls, hinting at possible selling pressure.
  • Histogram: The bars of the histogram provide a visual representation of momentum. Expanding bars suggest increasing momentum, while shrinking bars indicate weakening momentum.

The Limitations of the MACD

While the MACD offers valuable insights, it's crucial to remember it's not a foolproof system:

  • Lag: As the MACD is based on moving averages, it inherently lags behind price action. This means it might not capture sudden shifts in the market.
  • False Signals: Crossovers and divergences don't guarantee future price movements. Always combine the MACD with other technical indicators and fundamental analysis for confirmation.
  • Overbought/Oversold: The MACD is not designed to identify overbought or oversold conditions. Utilize other indicators like the Relative Strength Index (RSI) for this purpose.

Conclusion

The MACD, like any technical tool, is best used in conjunction with a comprehensive trading strategy. By understanding its calculation, interpreting its signals, and acknowledging its limitations, you can unlock its potential to gain valuable insights into market trends and make informed trading decisions. Remember, the key to success lies not in relying solely on any single indicator, but in utilizing a combination of tools and your own sound judgment. So, dive deeper, experiment, and trade with confidence!

If you love to understand the technical analysis that goes behind understanding the time of entry and exit, make sure to check out my course on Technical Analysis. Until next time!

What is MACD..?
Read More
Technical Analysis of EMAMILTD & NMDC

Stock name: Emami Ltd.

Pattern: Double top pattern

Time frame: Daily

Observation:

Starting March 2023, the stock displayed an upward trend, stabilizing from August 2023 and forming a double top pattern on the daily chart between August 2023 and February 2024. A breakout from this pattern occurred on February 8, 2024, leading to a subsequent downward movement. The stock's RSI is currently at a notably low level. Technical analysis suggests that if the stock maintains this momentum, it may experience further downward movement.

You may add this to your watch list to understand further price action.

Disclaimer: This analysis is purely for educational purpose and does not contain any recommendation. Please consult your financial advisor before taking any financial decision.

Stock name: NMDC Ltd.

Pattern: Rounding bottom pattern

Time frame: Monthly

Observation:

Since January 2010, the stock has experienced a downward trend, followed by a stabilizing phase over an extended period, showing signs of improvement only recently. It has successfully reached its March-April 2011 levels and exhibited a rounding bottom pattern between March 2011 and January 2024, culminating in a breakout in January 2024. This breakout was accompanied by above-average trading volume. However, caution is warranted as the stock is currently in an overbought state according to the RSI, and a bearish pattern has formed on its daily chart, suggesting a potential retest of the breakout levels. Despite these challenges, according to technical analysis, maintaining the breakout momentum may lead to further upward movement.

You may add this to your watch list to understand further price action.

Disclaimer: This analysis is purely for educational purpose and does not contain any recommendation. Please consult your financial advisor before taking any financial decision.


News for the day:

  • Paytm Payments Bank and Paytm are discontinuing inter-company agreements in response to regulatory scrutiny, with Paytm Payments Bank instructed by the Reserve Bank of India to halt basic banking services from March 16. Founder Vijay Shekhar Sharma resigned from the Payments Bank's board, and Paytm aims to strengthen independent operations amid ongoing regulatory actions, including SoftBank reducing its stake in Paytm to 2.83%.

  • The merger of Reliance Industries Ltd (RIL) subsidiary Viacom18 and The Walt Disney Company’s local unit Star India, with a total valuation of Rs 70,352 crore ($8.5 billion), is set to establish the largest media entity in India. With Reliance Industries infusing Rs 11,500 crore, the combined entity is expected to command over 40% viewership share, enabling it to secure premium advertising rates and high consumer average revenue per user (ARPU). The failure of the Zee Entertainment Enterprises and Sony Pictures Networks India merger is seen as advantageous for Star-Viacom18, preventing a potential duopoly in the market.

  • The Indian government has increased the windfall tax on petroleum crude from Rs 3,300 to Rs 4,600 per metric ton, effective March 1, as per a government order. Simultaneously, the windfall tax on diesel has been reduced to zero from Rs 1.50 per litre, while the taxes on petrol and aviation turbine fuel remain unchanged at nil. The windfall tax was initially imposed on crude oil producers in July 2022 and has since been regularly revised by the government.
Technical Analysis of EMAMILTD & NMDC
Read More