Stock name: Dalmia Bharat Ltd.
Pattern: Double top pattern
Time frame: Daily
Observation:
Starting from June 2022, the stock has consistently trended upwards. From August 2023 to March 2024, it stabilized and formed a double top pattern on its weekly chart. In early March 2024, the stock broke out of this pattern. Following the breakout, it has been descending accompanied by a low RSI level. Technical analysis suggests that if this momentum persists, the stock may continue its downward trajectory.
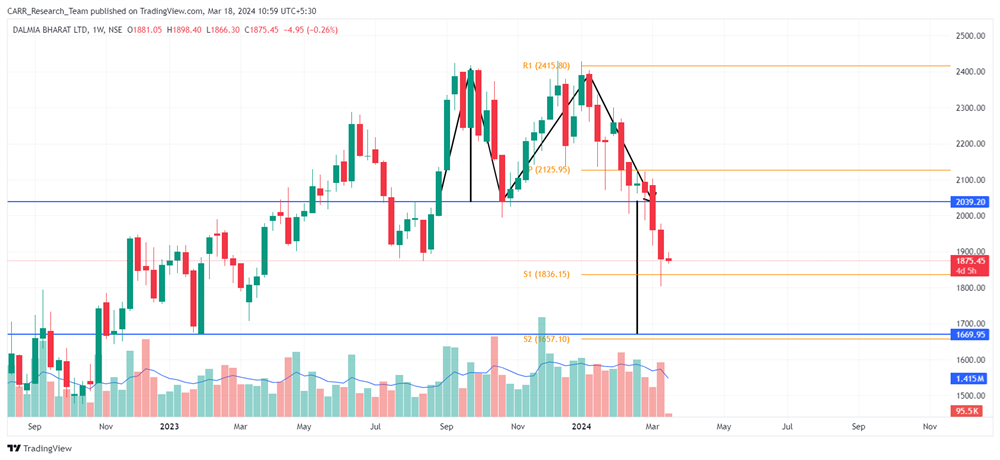
You may add this to your watch list to understand further price action.
Disclaimer: This analysis is purely for educational purpose and does not contain any recommendation. Please consult your financial advisor before taking any financial decision.

Stock name: Rashtriya Chemicals & Fertilizers Ltd.
Pattern: Head and shoulder pattern
Time frame: Daily
Observation:
Post COVID the stock has seen upwards movement in the overall view. This consolidated and from December 2023 to March 2024, a head and shoulder pattern emerged on the daily chart. Notably, around March 12 and 13, 2024, the stock experienced a breakout from this pattern, accompanied by average trading volume. Presently, the stock's RSI level indicates significant weakness. Technical analysis suggests that if this momentum persists, the stock may potentially witness further decline.
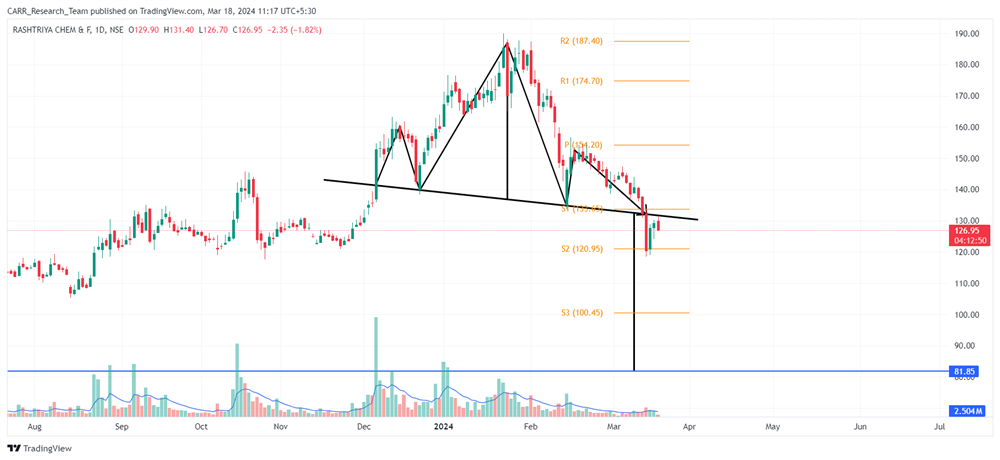
You may add this to your watch list to understand further price action.
Disclaimer: This analysis is purely for educational purpose and does not contain any recommendation. Please consult your financial advisor before taking any financial decision.
News for the day:
- Muthoot Microfin, part of Muthoot Pappachan Group, expands its reach into Telangana and plans entry into Andhra Pradesh by June. Following a state high court ruling, microfinance lenders are returning to these states. The Kerala-based NBFC-MFI aims to open four branches in Telangana this month, focusing on increasing its distribution network and customer base.
- The Indian government has increased the windfall tax on petroleum crude to Rs 4,900 per tonne. This hike comes amidst soaring global crude oil prices and aims to augment revenues amid economic challenges. The move is expected to impact oil refining companies, potentially leading to increased costs for consumers.
- Some Adani Group's dollar-denominated bonds have experienced significant declines, marking their steepest fall in over six months, following reports of a US investigation. Allegations suggest that Adani Group companies may have violated environmental norms and regulatory requirements. This development has sparked concerns among investors, leading to a sell-off in Adani Group bonds.
?")