Filter
RSS

Blog posts of '2024' 'February'

Technical Analysis of HEG & KANSAINER

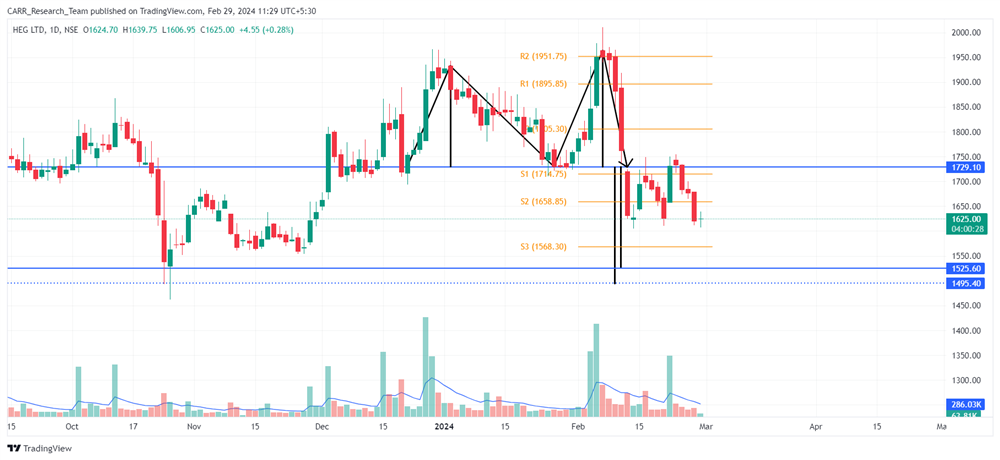
Stock name: H.E.G. Ltd.

Pattern: Double top pattern

Time frame: Daily

Observation:

The stock displayed an upward trend from April 2023, followed by a stabilization period and the formation of a double top pattern from December 2023 to February 2024. The breakout from the double top pattern on February 13, 2024, was accompanied by average trading volume and a bearish MACD signal. Despite a retest of levels, the stock experienced a subsequent downward movement. Currently the RSI of the stock is also at an unfavourable level. According to technical analysis, if the current momentum persists, the stock may continue its downward trajectory.

You may add this to your watch list to understand further price action.

Disclaimer: This analysis is purely for educational purpose and does not contain any recommendation. Please consult your financial advisor before taking any financial decision.

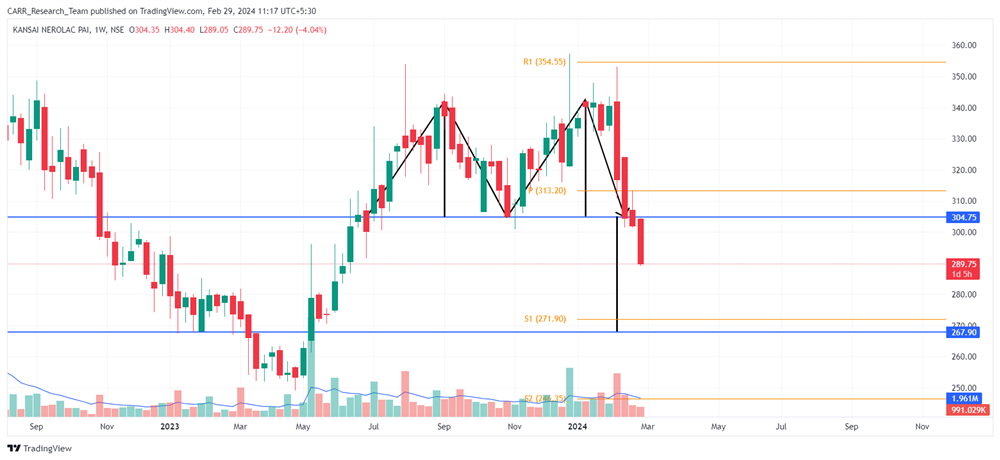
Stock name: Kansai Nerolac Paints Ltd.

Pattern: Double top pattern

Time frame: Weekly

Observation:

Experiencing an upward trend since April 2023, the stock underwent a stabilization phase and formed a double top pattern from June 2023 to February 2024 on the weekly chart. A breakout occurred in February 2024, supported by average trading volume. Subsequently, the stock shifted in a downward direction, and as per technical analysis, it may sustain this downward trajectory if the current momentum persists.

You may add this to your watch list to understand further price action.

Disclaimer: This analysis is purely for educational purpose and does not contain any recommendation. Please consult your financial advisor before taking any financial decision.


News for the day:

  • IndiGo has unveiled expansion plans with six new domestic routes starting March 31, 2024, including direct flights like Ahmedabad-Rajkot and Kolkata-Srinagar. The move aims to meet increasing travel demand, positioning the airline strategically in the competitive aviation market.

  • Reliance Industries has entered into a strategic partnership with Sri Lanka-based Elephant House, a prominent beverage maker. The collaboration aims to expand Reliance's footprint in the fast-moving consumer goods (FMCG) sector, marking a significant move in strengthening its presence in the international market.

  • Tata Group is set to unveil a semiconductor manufacturing unit soon. N. Chandrasekaran, the Chairman of Tata Sons, confirmed the impending announcement, signalling Tata's entry into the electronics and semiconductor industry.
Technical Analysis of HEG & KANSAINER
Read More
Technical Analysis of YESBANK & INFIBEAM

Stock name: Yes Bank Ltd.

Pattern: Cup and handle pattern and retest

Time frame: Daily

Observation:

Between December 2022 and February 2024, the stock displayed a cup and handle pattern on its daily chart. On February 7, 2024, the stock experienced a breakout from this pattern, accompanied by substantial trading volume and a positive MACD indicator signal. Following the breakout, the stock trended upward, but it is currently undergoing a significant retest and has closed below the breakout level. Both the RSI and MACD indicators are in the bearish zone, suggesting a potential downturn. According to technical analysis, a substantial rebound and positive momentum are crucial for the stock to move upward.

You may add this to your watch list to understand further price action.

Disclaimer: This analysis is purely for educational purpose and does not contain any recommendation. Please consult your financial advisor before taking any financial decision.

Stock name: Infibeam Avenues Ltd.

Pattern: Double bottom pattern and retest

Time frame: Weekly

Observation:

Experiencing a significant decline since September 2018, the stock recently formed a double bottom pattern on its weekly chart. It has registered a breakout out in January 2024 with average trading volume support. Subsequent to the breakout, the stock trended upward, but it is presently undergoing a retest. The stock's RSI is in the overbought zone, suggesting a potential correction. According to technical analysis, a successful rebound from the retest may propel the stock further upward.

You may add this to your watch list to understand further price action.

Disclaimer: This analysis is purely for educational purpose and does not contain any recommendation. Please consult your financial advisor before taking any financial decision.


News for the day:

  • Maruti Suzuki has formed a partnership with Union Bank of India to offer dealer financing solutions. The collaboration aims to enhance the accessibility of financing options for Maruti Suzuki dealers, facilitating smoother operations and promoting growth in the auto industry. This strategic alliance is expected to strengthen the financial support system for dealers, potentially contributing to increased vehicle sales and market expansion for Maruti Suzuki in India.

  • Patanjali Foods reassures that the recent Supreme Court observations on advertisements by the promoter group will not impact its business operations. The company responds confidently, asserting that its day-to-day functions will continue unaffected by the court's remarks on promotional activities.

  • DCM Shriram is set to invest Rs 1,000 crore in a greenfield epoxy resin plant over the next few years. The industrial conglomerate aims to expand its footprint in the chemicals and fertilizers sector with this substantial investment. The new plant is expected to bolster DCM Shriram's production capabilities, contributing to its strategic growth plans in the chemical industry.
Technical Analysis of YESBANK & INFIBEAM
Read More
Technical Analysis of MAHABANK & CENTRALBK

Stock name: Bank of Maharashtra

Pattern: Rounding bottom pattern

Time frame: Monthly

Observation:

Since January 2008, the stock has been on a downward trajectory, with a notable recovery post-COVID. Presently, it has reached levels last seen in 2014 and formed a rounding bottom pattern on its monthly chart from July 2014 to January 2024. The breakout from this pattern occurred in January 2024, supported by above-average trading volume. The current overbought RSI suggests a potential retest. According to technical analysis, the stock may experience further upward movement if it maintains its current momentum.

You may add this to your watch list to understand further price action.

Disclaimer: This analysis is purely for educational purpose and does not contain any recommendation. Please consult your financial advisor before taking any financial decision.

Stock name: Central Bank of India

Pattern: Cup and handle pattern and retest

Time frame: Weekly

Observation:

Since May 2017, the stock has exhibited a consistent decline. Notably, from September 2018 to January 2024, it underwent the formation of a cup and handle pattern on its weekly chart, culminating in a breakout in January 2024. This breakout was accompanied by above-average trading volume and a positive MACD indicator signal. Subsequent to the breakout, the stock initiated an upward movement, although it is presently undergoing a retest phase. The RSI currently resides in the overbought zone, suggesting a potential cooldown. Technical analysis suggests that a successful rebound from the retest and the establishment of upward momentum may move the stock in an upward trajectory.

You may add this to your watch list to understand further price action.

Disclaimer: This analysis is purely for educational purpose and does not contain any recommendation. Please consult your financial advisor before taking any financial decision.


News for the day:

  • GIFT City, India's international financial center, is seeking approval from the Reserve Bank of India (RBI) to establish a Real-Time Gross Settlement (RTGS)-like system for dollar payments. This move aims to enhance efficiency in dollar transactions within the Gift City ecosystem. The proposed system is expected to streamline and expedite dollar transactions, promoting a more seamless financial environment.

  • The Reserve Bank of India (RBI) has imposed fines totalling nearly Rs 3 crore on State Bank of India (SBI), Canara Bank, and City Union Bank. The penalties were levied for non-compliance with various regulatory guidelines and norms. SBI faced fines for deficiencies in regulatory compliance, while Canara Bank and City Union Bank were penalized for lapses in the area of cybersecurity and fraud risk management.

  • Reliance Industries and Disney reportedly may announce a merger between their media subsidiaries, Star India and Viacom18, this week. This strategic move aims to create a powerhouse in the Indian media and entertainment industry. The merged entity is expected to combine a diverse range of content and broadcasting assets, potentially reshaping the dynamics of the sector.
Technical Analysis of MAHABANK & CENTRALBK
Read More
Technical Analysis of LICHSGFIN & ASTRAL

Stock name: LIC Housing Finance Ltd.

Pattern: Double bottom pattern

Time frame: Weekly

Observation:

Since June 2017, the stock has experienced a downtrend. From July 2019 to January 2024, it stabilized and exhibited a double bottom pattern on the weekly chart. In early January 2024, the stock broke out from the pattern with above-average trading volume, leading to an upward movement. The current overbought zone RSI suggests a potential retest. As per technical analysis, if the stock maintains its momentum, then it may see further upward movement.

You may add this to your watch list to understand further price action.

Disclaimer: This analysis is purely for educational purpose and does not contain any recommendation. Please consult your financial advisor before taking any financial decision.

Stock name: Astral Ltd.

Pattern: Flag and pole pattern

Time frame: Weekly

Observation:

Between April and June 2023, the stock underwent a swift upward surge. Following that, it entered a consolidation phase until February 2024, forming a flag and pole pattern on the weekly chart. The breakout from this pattern happened in February 2024, marked by significant trading volume and a positive MACD indicator signal. The RSI levels of the stock are also in a favourable zone. As per technical analysis, the stock might experience additional upward movement, as long as it maintains its current momentum.

You may add this to your watch list to understand further price action.

Disclaimer: This analysis is purely for educational purpose and does not contain any recommendation. Please consult your financial advisor before taking any financial decision.


News for the day:

  • Reliance Industries Limited (RIL) has announced plans to invest Rs 5,000 crore in setting up compressed biogas (CBG) plants. The CBG plants aim to produce green energy by converting bio and organic waste into compressed biogas, contributing to the reduction of carbon emissions. This move reflects RIL's strategic focus on renewable energy initiatives, supporting India's push towards a cleaner and more environmentally friendly energy landscape.

  • The Reserve Bank of India (RBI) has granted approval for HDFC Bank's proposal to sell a 90% stake in HDFC Credila to ChrysCapital and BPEA EQT. This strategic move by HDFC Bank aligns with its efforts to streamline its business operations. HDFC Credila, specializing in education loans, is expected to benefit from the expertise and support of ChrysCapital and BPEA EQT.

  • State Bank of India (SBI) faces challenges in finding buyers for the Rs 1,703 crore bad debt linked to Hindusthan National Glass. Despite efforts, SBI's attempts to attract buyers for the distressed debt have not yielded positive results. SBI's struggle to offload the bad debt highlights broader challenges in the market and the financial sector's ongoing efforts to manage and resolve non-performing assets.
Technical Analysis of LICHSGFIN & ASTRAL
Read More
Technical Analysis of Abbott India & Adani Green

Stock name: Abbott India Ltd.

Pattern: Cup and handle pattern

Time frame: Weekly

Observation:

Experiencing an upward trajectory, the stock displayed a cup and handle pattern on its weekly chart from October 2021 to January 2024. A breakout from this pattern occurred in January 2024, backed by above average trading volume and a positive MACD indicator signal. Following the breakout, the stock is advancing in an upward direction. With the current RSI levels in the overbought zone, the stock may see some retest. According to technical analysis, the stock may continue its upward movement if it sustains its current momentum.

You may add this to your watch list to understand further price action.

Disclaimer: This analysis is purely for educational purpose and does not contain any recommendation. Please consult your financial advisor before taking any financial decision.

Stock name: Adani Green Energy Ltd.

Pattern: Flag and pole pattern

Time frame: Daily

Observation:

Following a long period of stabilization and sideways movement, the stock exhibited a rapid upward surge between November 23, 2023, and December 7, 2023. Subsequently, the stock resumed consolidation until February 2024, resulting in the development of a flag and pole pattern on the daily chart. A breakout from this pattern occurred on February 7, 2024, accompanied by substantial trading volume and a positive MACD indicator signal. The stock is currently on an upward trajectory post-breakout, supported by favourable RSI levels. Based on technical analysis, the stock may see further upward movement if it sustains its present momentum.

You may add this to your watch list to understand further price action.

Disclaimer: This analysis is purely for educational purpose and does not contain any recommendation. Please consult your financial advisor before taking any financial decision.


News for the day:

  • Shriram Group is reportedly planning to raise up to Rs 2,400 crore to acquire a stake in its group companies currently held by Piramal Enterprises. The move aims to facilitate Shriram's buyback of the stake from Piramal and strengthen its position in various subsidiaries. The fundraising strategy involves a mix of debt and equity. Shriram Group has a diverse presence in sectors such as finance, insurance, and infrastructure, and this financial manoeuvre is expected to impact its strategic positioning within the conglomerate.

  • Bandhan Bank has appointed Rajeev Mantri, formerly associated with Citi India, as its Chief Financial Officer. This strategic hiring signals the bank's focus on strengthening its financial leadership and management. Rajeev Mantri brings his expertise from Citi India to the role, and his experience is expected to contribute to Bandhan Bank's financial strategies and operations.

  • Grasim Industries has entered the paint business with the launch of 'Birla Opus.' The company aims to secure the second-largest position in the Indian paint sector through this venture. Grasim Industries, part of the Aditya Birla Group, is diversifying its portfolio with this strategic move into the competitive paint industry. 'Birla Opus' will offer a range of paint products, and Grasim is set to leverage its brand reputation and distribution network to establish a significant presence in the market.
Technical Analysis of Abbott India & Adani Green
Read More
Technical Analysis of MPHASIS & MOTILALOFS

Stock name: MphasiS Ltd.

Pattern: Cup and handle pattern and retest

Time frame: Weekly

Observation:

Since October 2021, the stock experienced a decline, but between June 2022 and December 2023, it stabilized and exhibited a cup and handle pattern on the weekly chart. In December 2023, there was a breakout, supported by substantial trading volume and a positive MACD indicator. Although the stock showed a modest upward movement post-breakout, it is currently undergoing a retest. The RSI has cooled down to a favourable level. According to technical analysis, a successful rebound from the retest may propel the stock further upward.

You may add this to your watch list to understand further price action.

Disclaimer: This analysis is purely for educational purpose and does not contain any recommendation. Please consult your financial advisor before taking any financial decision.

Stock name: Motilal Oswal Financial Services Ltd.

Pattern: Rounding bottom pattern

Time frame: Monthly

Observation:

Since January 2018, the stock has been on a decline, but it began recovering from March 2023. In January 2024, it reached its January 2018 level. Over the period from January 2018 to January 2024, the stock formed a rounding bottom pattern on the monthly chart, breaking out in January 2024 with significant trading volume. However, the rapid upward movement has placed the stock's RSI in the overbought zone, suggesting a potential retest of the breakout level. According to technical analysis, if the stock can sustain its current momentum, further upward movement may be expected.

You may add this to your watch list to understand further price action.

Disclaimer: This analysis is purely for educational purpose and does not contain any recommendation. Please consult your financial advisor before taking any financial decision.


News for the day:

  • JK Cement has successfully completed the acquisition of Toshali Cement in Odisha, India. The acquisition marks a strategic move by JK Cement in the industrial goods sector, specifically in the cement industry. The completion of this acquisition further strengthens JK Cement's market presence and may contribute to its expansion plans.

  • ITC is reportedly considering the acquisition of a 47% stake in Prataap Snacks, the maker of popular snack brand 'Yellow Diamond.' Private equity funds are also said to be exploring opportunities to invest in Prataap Snacks. If successful, this move could lead to significant changes in the competitive landscape of the Indian snack food sector. Prataap Snacks has established itself as a key player, and an investment from ITC could enhance its growth prospects.

  • SpiceJet has bolstered its financial position by raising an additional Rs 316 crore through fundraising. This move is part of the airline's ongoing efforts to strengthen its financial resilience. SpiceJet has faced challenges in the aviation industry, and the latest fundraising is expected to provide the company with much-needed liquidity. The successful fundraising may contribute to the airline's operational stability and strategic initiatives in the competitive aviation sector.
Technical Analysis of MPHASIS & MOTILALOFS
Read More
Technical Analysis of TIMKEN & FDC

Stock name: Timken India Ltd.

Pattern: Double top pattern

Time frame: Weekly

Observation:

Following the market's rebound after the COVID-19 pandemic, the stock exhibited a consistent upward trend. While it briefly stabilized in 2023, a double top pattern emerged on its weekly chart from April 2023 to February 2024. February 2024 witnessed a breakout from this pattern, backed by a marginally higher trading volume and a bearish signal from the MACD indicator. Subsequently, the stock has entered a downward trajectory, with its RSI hovering just above the 35 level. According to technical analysis, the stock might continue its descent if the current momentum persists.

You may add this to your watch list to understand further price action.

Disclaimer: This analysis is purely for educational purpose and does not contain any recommendation. Please consult your financial advisor before taking any financial decision.

Stock name: FDC Ltd.

Pattern: Cup and handle pattern

Time frame: Weekly

Observation:

The stock has been on a sideways trend for a long period of time. From July 2021 to January 2024 the stock has formed a cup and handle pattern on its weekly chart. In January 2024, the stock experienced a breakout from this pattern, aided by substantial trading volume and a positive MACD indicator signal. According to technical analysis, should the stock sustain its existing momentum, it may see continued upward movement in the future.|

You may add this to your watch list to understand further price action.

Disclaimer: This analysis is purely for educational purpose and does not contain any recommendation. Please consult your financial advisor before taking any financial decision.


News for the day:

  • Reliance Industries, under the leadership of Mukesh Ambani, is set to introduce "Hanooman," an artificial intelligence (AI) model, in India by March. This AI model, designed to enhance operational efficiency, has already been successfully deployed in various Reliance businesses. Known for its robust capabilities, Hanooman is expected to play a significant role in advancing technological applications within the conglomerate.

  • NTPC's subsidiary, NTPC Green Energy Ltd (NGEL), has entered into a partnership with Andhra Pradesh (AP) to establish India's largest green hydrogen production facility. This collaboration aims to advance the development of renewable energy infrastructure, particularly in the form of green hydrogen. The facility is expected to contribute significantly to the nation's green energy goals.

  • Tata Steel and JSW Steel are among the prominent bidders participating in the commercial coal block auction for mines in India. The auction, facilitated by the government, aims to attract investments and boost domestic coal production. Several leading steel companies, including Tata Steel and JSW Steel, are vying for the rights to develop and operate these coal mines.
Technical Analysis of TIMKEN & FDC
Read More
Technical Analysis of IOC & PNCINFRA

Stock name: Indian Oil Corporation Ltd.

Pattern: Rounding bottom pattern

Time frame: Monthly

Observation:

Experiencing a recent upward movement, the stock now exceeds its 2017 levels. The stock has seen a decline since September 2017 and has recovered now. The monthly chart shows a rounding bottom pattern, and a breakout occurred in February 2024. Though the candle of February month is not completed, the stock has seen a significant breakout along with huge trading volumes. However, the stock's RSI levels signal deep overbought conditions. As per technical analysis, the upcoming days may see a retest of the breakout, and successful rebound may lead to further upward movement.

You may add this to your watch list to understand further price action.

Disclaimer: This analysis is purely for educational purpose and does not contain any recommendation. Please consult your financial advisor before taking any financial decision.

Stock name: PNC Infratech Ltd.

Pattern: Cup and handle pattern and retest

Time frame: Weekly

Observation:

The stock has consistently trended upward, and between October 2021 and January 2024, it formed a cup and handle pattern on the weekly chart. January 2024 witnessed a breakout from this pattern, accompanied by above-average trading volume and a positive MACD indicator signal. Following the breakout, the stock moved upward but is currently undergoing a retest. The RSI level of the stock has cooled down due to this pullback. According to technical analysis, a successful rebound from the retest may propel the stock further upward.

You may add this to your watch list to understand further price action.

Disclaimer: This analysis is purely for educational purpose and does not contain any recommendation. Please consult your financial advisor before taking any financial decision.


News for the day:

  • JSW Steel is reportedly in discussions to acquire a $1 billion stake in Australia's Blackwater coal mine. The potential investment marks JSW Steel's interest in securing a stake in the mining sector and expanding its presence in Australia. If the deal materializes, it could enhance JSW Steel's access to key resources for its operations. The talks indicate a strategic move by JSW Steel to strengthen its position in the global metals and mining industry.

  • TVS Mobility has formed a joint venture with Mitsubishi Corp to create a comprehensive vehicle mobility ecosystem in India. The collaboration combines TVS Mobility's expertise with Mitsubishi Corp's global experience to develop innovative solutions for the Indian mobility sector.

  • Zee Entertainment and Sony Pictures Networks are reportedly in talks to salvage their proposed merger after facing challenges. The media giants are engaged in discussions to address issues that have arisen during the merger process, indicating efforts to find a resolution and proceed with the high-profile deal.
Technical Analysis of IOC & PNCINFRA
Read More
Technical Analysis of PVRINOX & INGERRAND

Stock name: PVR INOX Ltd.

Pattern: Head and shoulders pattern

Time frame: Weekly

Observation:

The stock's overall trajectory has been positive. It has stabilised between the period from May 2021 to February 2024. During this period, a head and shoulder pattern emerged on the weekly chart, followed by a breakout in February 2024. This breakout was supported by slightly above average trading volume. Post-breakout, the stock is now trending downward. Technical analysis suggests that if the momentum from the breakout is sustained, then the stock may see further downward movement.

You may add this to your watch list to understand further price action.

Disclaimer: This analysis is purely for educational purpose and does not contain any recommendation. Please consult your financial advisor before taking any financial decision.

Stock name: Ingersoll Rand (India) Ltd.

Pattern: Cup and handle pattern

Time frame: Daily

Observation:

The stock is currently on an upward trajectory. It has formed a cup and handle pattern on its daily chart between August 2023 and February 2024. A significant breakout from this pattern occurred on February 16, 2024, accompanied by substantial trading volume. The stock is presently aligning with the direction established by the breakout. Technical analysis indicates that if the stock can sustain this breakout momentum, then it may see further upward movement in its value.

You may add this to your watch list to understand further price action.

Disclaimer: This analysis is purely for educational purpose and does not contain any recommendation. Please consult your financial advisor before taking any financial decision.


News for the day:

  • Adani Group is in advanced talks to raise $2.6 billion for infrastructure and green projects, considering a stake reduction in airport and green hydrogen units. The conglomerate, recently resilient after overcoming challenges, aims for an Ebitda of Rs 80,000 crore this fiscal year and has attracted investments from GQG Partners, QIA, and TotalEnergies.

  • Mahindra & Mahindra has signed a supply agreement with Volkswagen Group for components to boost its INGLO electric platform, incorporating electric elements from Volkswagen's MEB and unified cells. The deal spans several years with a total volume of approximately 50 GWh. Mahindra plans to launch five all-electric SUVs in India through INGLO starting December 2024.

  • Tata Power is set to acquire the Jalpura Khurja Power Transmission project for Rs 838 crore, following a letter of intent from REC Power Development and Consultancy. The project's special purpose vehicle will be developed on a build-own-operate-transfer basis, offering transmission services for 35 years from the scheduled date of commercial operation.
Technical Analysis of PVRINOX & INGERRAND
Read More