Filter
RSS

Blog posts of '2024' 'February'

Technical Analysis of BANKBARODA & BPCL

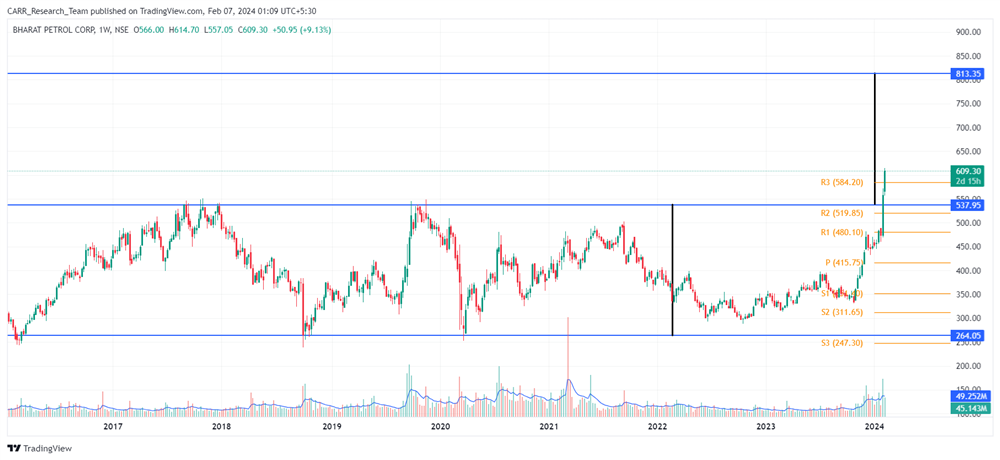
Stock name: Bharat Petroleum Corporation Ltd.

Pattern: Resistance breakout

Time frame: Weekly

Observation:

Over an extended duration, the stock has moved between 260 and 530, creating a parallel channel from 2016 to 2024 on its weekly chart. In January 2024, the stock experienced a breakout from the parallel channel's resistance, backed by higher-than-average trading volume. Post breakout the stock moved in the upward direction. According to technical analysis, the stock may see further upward movement if it can sustain the momentum generated by the breakout.

You may add this to your watch list to understand further price action.

Disclaimer: This analysis is purely for educational purpose and does not contain any recommendation. Please consult your financial advisor before taking any financial decision.

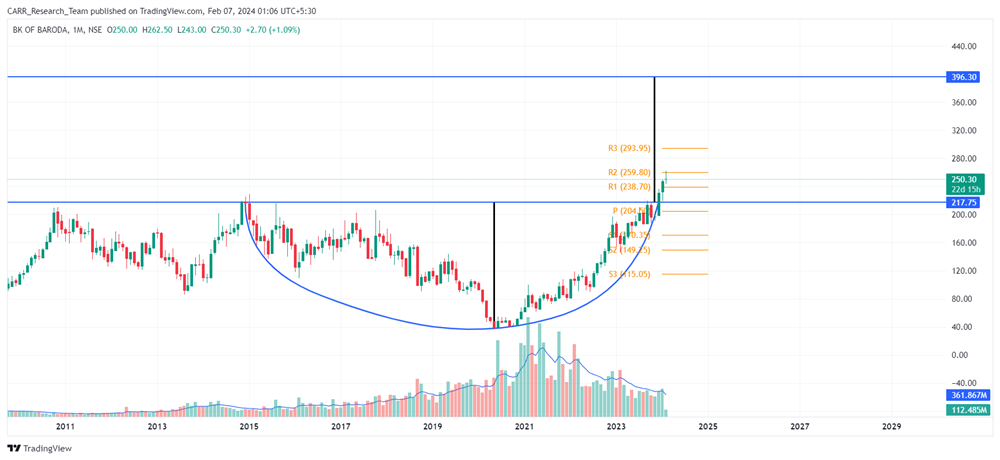
Stock name: Bank of Baroda

Pattern: Rounding bottom pattern

Time frame: Monthly

Observation:

Following its all-time high in January 2015, the stock experienced a downward trend until recently when it began an upward trajectory. Presently, the stock has reached the same level as in 2015, forming a rounding bottom pattern from 2015 to 2023. Towards the end of 2023 in the month of December 2023, the stock has registered a breakout, supported by average trading volume. Post-breakout, the stock is on an upward trajectory, and technical analysis suggests that the stock may see further upward movement if the current momentum is sustained.

You may add this to your watch list to understand further price action.

Disclaimer: This analysis is purely for educational purpose and does not contain any recommendation. Please consult your financial advisor before taking any financial decision.

News for the day:

  • The Reserve Bank of India (RBI) is considering issuing a clarification regarding Paytm due to its substantial user base. This move comes amid concerns and speculations surrounding Paytm's financial health. The potential clarification aims to address uncertainties and reassure users and stakeholders about the stability of Paytm's operations. The RBI's intervention seeks to provide transparency and alleviate any apprehensions within the market regarding the popular digital payment platform.

  • Prime Minister Narendra Modi has highlighted that the energy sector will receive a significant portion of infrastructure investment in India. This underscores the government's commitment to enhancing energy infrastructure to meet growing demands and promote sustainability. The focus on the energy sector aligns with efforts to boost energy security and support economic growth in the country.

  • The Indian government is exploring the possibility of leasing strategic oil reserve space to private companies as a strategy to enhance energy security. This move signifies a shift towards involving the private sector in efficiently managing and maintaining strategic oil reserves to address dynamic challenges in the global oil market.


Technical Analysis of BANKBARODA & BPCL
Read More
Technical Analysis of MGL & AUBANK

Stock name: Mahanagar Gas Ltd.

Pattern: Resistance breakout

Time frame: Monthly

Observation:

For an extended duration, the stock has fluctuated within the range of Rs. 720 to Rs. 1200, establishing a parallel channel from 2016 to 2024 on its monthly chart. However, a noteworthy development occurred in January 2024 when the stock decisively broke out from the resistance of this parallel channel. This breakout was accompanied by trading volume surpassing the average. According to technical analysis, should the stock sustain its newfound momentum, then it may see further upward movement.

You may add this to your watch list to understand further price action.

Disclaimer: This analysis is purely for educational purpose and does not contain any recommendation. Please consult your financial advisor before taking any financial decision.

Stock name: AU Small Finance Bank Ltd.

Pattern: Double top pattern

Time frame: Weekly

Observation:

While exhibiting a general upward trajectory, the stock temporarily stabilized from April 2023 to January 2024, forming a double top pattern on its weekly chart. Towards the end of January 2024, the stock experienced a breakout from this pattern, accompanied by substantial trading volume. Additionally, the stock's RSI is at lower levels, and the MACD indicator has signaled a negative trend. Based on technical analysis, if the stock continues with the prevailing momentum it may see continuation of downward movement.

You may add this to your watch list to understand further price action.

Disclaimer: This analysis is purely for educational purpose and does not contain any recommendation. Please consult your financial advisor before taking any financial decision.


News for the day:

  • The Reserve Bank of India (RBI) has granted approval to HDFC Bank and its group to acquire a 9.5% stake in both Yes Bank and IndusInd Bank. This move signals a strategic development in the banking sector as HDFC Bank strengthens its position by acquiring stakes in two prominent banks, in line with regulatory consent from the RBI. The approvals open avenues for collaboration and potential synergies within the banking industry, reflecting the evolving landscape of financial institutions in India.

  • Paytm has refuted speculations regarding an acquisition by Jio Financials of its wallet business. The company has clarified that no such discussions or plans are underway. This denial comes in response to recent rumours suggesting a potential acquisition, emphasizing that Paytm remains independent and is not currently in talks for any such transaction with Jio Financials.

  • Adani Total Gas and INOXCVA have partnered to bolster the LNG ecosystem in India, focusing on enhancing distribution and supply infrastructure. This collaboration aims to promote the use of LNG as a cleaner and sustainable energy source, contributing to the growth of India's energy sector.
Technical Analysis of MGL & AUBANK
Read More
Technical Analysis of GLENMARK & RADICO

Stock name: Glenmark Pharmaceuticals Ltd.

Pattern: Flag and pole pattern

Time frame: Weekly

Observation:

Experiencing a swift ascent from March 2023 to September 2023, the stock then underwent a consolidation phase, adopting a sideways trajectory until January 2024. During this period, a flag and pole pattern materialized on the weekly chart. January 2024 marked a breakout, accompanied by above average trading volume and a favourable MACD indicator signal. Despite the breakout, the stock has maintained its lateral movement. According to technical analysis, if the stock is able to gain a momentum, it may propel the stock upward in the future.

You may add this to your watch list to understand further price action.

Disclaimer: This analysis is purely for educational purpose and does not contain any recommendation. Please consult your financial advisor before taking any financial decision.

Stock name: Radico Khaitan Ltd.

Pattern: Cup and handle pattern

Time frame: Weekly

Observation:

The stock has exhibited a consistent upward trajectory. From January 2022 to November 2023, a cup and handle pattern emerged on the weekly chart, culminating in a breakout at the close of November 2023. The breakout was substantiated by a notable surge in trading volume. Subsequent to the breakout, the stock continued its ascent. As per technical analysis if the current momentum is sustained then the stock may see further upward movement.

You may add this to your watch list to understand further price action.

Disclaimer: This analysis is purely for educational purpose and does not contain any recommendation. Please consult your financial advisor before taking any financial decision.


News for the day:

  • Hyundai is considering a listing of its local unit on Dalal Street for the largest IPO in India, aiming to raise $3.3-5.6 billion this Diwali, potentially valuing Hyundai Motor India at $22-28 billion. The move comes as Hyundai aims to capitalize on India's IPO surge, with HMIL being the second-largest passenger vehicle seller in the country after Maruti Suzuki.

  • Force Motors plans to invest Rs 2,000 crore over 3-4 years, emphasizing electric vehicle (EV) development, starting with the Traveller Electric. The investment will span sustainability and green energy initiatives, with a new paint shop installation. Managing Director Prasan Firodia anticipates continued strong growth of 25-35% due to government infrastructure focus and positive market sentiment.

  • The Singapore Arbitration Centre has denied Sony's request to prevent Zee Entertainment from pursuing the National Company Law Tribunal (NCLT) for a merger, terminated by Sony last month. The Emergency Arbitrator ruled lack of jurisdiction, enabling Zee Entertainment to proceed with its NCLT application, while Sony seeks a USD 90 million termination fee through arbitration. The NCLT had previously approved the merger in August 2023, and if completed, it would have created a USD 10 billion media entity.
Technical Analysis of GLENMARK & RADICO
Read More
What is Buyback of Shares?

What is Buyback of Shares?

As we are on our journey of unravelling the corporate actions, the next stop is a share buyback, in the dynamic world of corporate finance, companies often employ various strategies to enhance shareholder value and optimize their capital structure. One such strategic move that has gained prominence in recent years is the buyback of shares. Share buybacks, also known as share repurchase, involve a company repurchasing its own outstanding shares from the open market. In this blog post, we'll delve into the reasons why companies choose to buy back their shares and explore the benefits it brings to shareholders.

Understanding Share Buybacks

Share buybacks can take different forms, including open-market purchases or tender offers, where shareholders are invited to tender their shares at a specified price. The primary motivation behind share buybacks is often rooted in the desire to deploy excess cash in a manner that maximizes shareholder value. Generally, companies’ buyback shares at a price higher than the current market price.

There are two types of buybacks - tender offer where a company makes an offer to buy back its shares at a particular price (offer price) at which the shareholders can tender, i.e., sell their shares. and open market offer where a company can buy back its shares by actively buying from sellers on the exchange. Companies can choose either of these methods to buy back shares from their shareholders.

In the case of a tender offer, the existing shareholders as on a record date can opt to accept the offer and tender their shares in exchange for cash offered by the company as per the prescribed buyback ratio.

In the case of an open market offer, any Equity shareholder of the company can participate in the buyback offer through their stockbroker till the buyback window is open.

Let's explore some of the key reasons why companies opt for this financial strategy.

  1. Capital Structure Optimization

Companies often embark on share buybacks to optimize their capital structure. By reducing the number of outstanding shares, a company can increase its earnings per share (EPS) metric. This, in turn, makes each share more valuable, signalling positive financial health to investors and potentially boosting the company's stock price.

  1. Undervaluation Signal

When a company believes its shares are undervalued in the market, initiating a share buyback can be a way to communicate confidence in its own prospects. By repurchasing shares at what it perceives as a discounted price, the company signals to investors that it believes in the long-term value of its business.

  1. Return of Excess Cash

Companies occasionally find themselves in possession of excess cash with limited investment opportunities. Instead of letting the cash sit idly, they may choose to return it to shareholders through share buybacks. This approach is particularly appealing when the company believes that reinvesting the cash internally would not generate sufficient returns.

  1. Tax-Efficient Capital Return

Share buybacks can be a tax-efficient way to return capital to shareholders. While dividends are typically taxed as income, capital gains taxes on stock repurchases are often lower. This makes share buybacks an attractive option for companies aiming to provide returns to shareholders without the tax implications associated with dividends.

Now that we've explored why companies engage in share buybacks, let's turn our attention to the benefits shareholders can derive from this financial strategy.

  1. Enhanced Earnings per Share (EPS)

As mentioned earlier, one of the primary benefits of share buybacks is the potential enhancement of EPS. By reducing the number of outstanding shares, the company's earnings are distributed among fewer shares, leading to an increase in EPS. This can make the company more attractive to investors and potentially drive up the stock price.

  1. Share Price Appreciation

When a company buys back its shares, it signals confidence in its future prospects and a belief that the shares are undervalued. This confidence can be contagious, attracting other investors and driving up demand for the stock. As a result, shareholders may witness an appreciation in the value of their shares.

  1. Return on Investment

For shareholders who choose not to sell their shares during a buyback, the repurchased shares effectively increase their ownership stake in the company. This can be seen as a form of return on investment, as shareholders' ownership in the company becomes more concentrated.

  1. Tax Efficiency

Shareholders benefit from the tax efficiency of share buybacks, particularly compared to dividends. Capital gains taxes are generally lower than income taxes on dividends, providing shareholders with a more tax-friendly form of capital return.

In the complex world of corporate finance, share buybacks stand out as a strategic tool employed by companies to optimize their capital structure, signal confidence to investors, and return excess cash to shareholders. The benefits of share buybacks extend beyond the financial statements, positively impacting shareholders through enhanced EPS, share price appreciation, increased ownership stakes, and tax efficiency.

However, it's important for investors to approach share buybacks with a critical eye. Not all buybacks are created equal, and shareholders should evaluate the underlying reasons and financial health of the company before celebrating the announcement of a stock repurchase. As with any financial strategy, a well-informed and discerning approach is essential for both companies and shareholders to derive lasting benefits from share buybacks.

To understand more about such interesting concepts along with further interesting examples, check out my course on Basics of Stock Market.

Until next time !!!

What is Buyback of Shares?
Read More
Technical Analysis of APLLTD & GRAPHITE

APLLTD | INVERSE HEAD AND SHOULDER |

Stock name: Alembic Pharmaceuticals Ltd.

Pattern: Inverse head and shoulder pattern

Time frame: Weekly


Observation:

Since December 2020, the stock has experienced a decline. Between January 2022 and January 2024, it exhibited an inverse head and shoulder pattern on the weekly chart. The first week of January 2024 witnessed a breakout from this pattern, backed by above-average trading volume and a positive MACD indicator signal. Subsequently, the stock has been on an upward trajectory. According to technical analysis, the stock may continue its ascent if the current momentum is sustained.

You may add this to your watch list to understand further price action.

Disclaimer: This analysis is purely for educational purpose and does not contain any recommendation. Please consult your financial advisor before taking any financial decision.


GRAPHITE | INVERSE HEAD AND SHOULDER |

Stock name: Graphite India Ltd.

Pattern: Inverse head and shoulder pattern

Time frame: Weekly


Observation:

Since May 2021, the stock has undergone a downward trend. Between October 2021 and December 2023, it developed an inverse head and shoulder pattern on its weekly chart. In December 2023, the stock successfully broke out from this pattern with substantial trading volume and a positive MACD indicator signal. Following the breakout, there was a retest of the breakout level. Presently, the stock's RSI levels are favourable. Technical analysis suggests that if the stock rebounds from the retest, it may continue its upward movement.

You may add this to your watch list to understand further price action.

Disclaimer: This analysis is purely for educational purpose and does not contain any recommendation. Please consult your financial advisor before taking any financial decision.

--------------------------------------------------

News for the day:

  • Vodafone Idea (Vi) aims to roll out 5G services in India within the next six months, according to reports. The telecom company is gearing up to introduce the next-generation technology to enhance its network capabilities.

  • Consumer electronics companies anticipate a surge in household appliance adoption following Budget 2024's emphasis on housing and solar schemes. The budget includes plans for rooftop solarization, providing free electricity to one crore households. Industry executives foresee medium-to-long-term sales growth, particularly in the housing sector and solar appliances.

  • The electric vehicle sector awaits clarity on FAME subsidy extension, as the interim budget did not address the future of FAME II set to expire in March. Industry seeks specifics on subsidies and taxation, highlighting challenges like parking space for light EVs and urging a comprehensive strategy, including reduced GST rates and affordable financing for critical infrastructure.
Technical Analysis of APLLTD & GRAPHITE
Read More