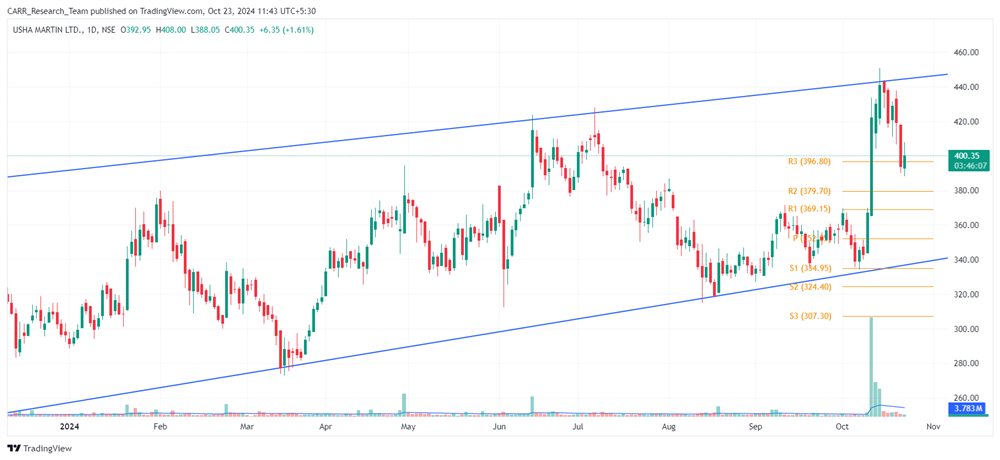
Stock name: Usha Martin Ltd.
Pattern: Parallel channel pattern
Time frame: Daily
Observation:
In the previous blog (please refer here), the stock was noted to be moving within a parallel channel pattern. It previously rebounded from the support line, rising to reach the channel's resistance line. From October 16th onwards, the stock was unable to sustain the momentum and it has started moving downward, staying within the channel. Further price action of the stock is to be checked to see if it will continue in the parallel channelBottom of Form.

You may add this to your watch list to understand further price action.
Disclaimer: This analysis is purely for educational purpose and does not contain any recommendation. Please consult your financial advisor before taking any financial decision.
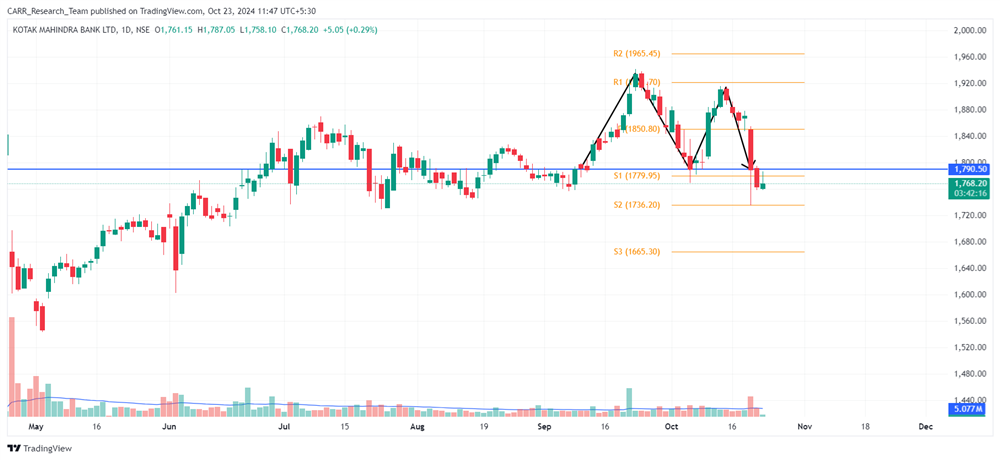
Stock name: Kotak Mahindra Bank Ltd.
Pattern: Double top pattern
Time frame: Daily
Observation:
Since May 2024, the stock has shown some upward movement. Between September and October 2024, it formed a double top pattern on the daily chart, with a breakdown occurring on October 21, 2024, supported by strong trading volume. Based on technical analysis, if this momentum persists, the stock may experience further decline. It's advisable to look for additional confirmations, such as RSI levels and the MACD indicator.

You may add this to your watch list to understand further price action.
Disclaimer: This analysis is purely for educational purpose and does not contain any recommendation. Please consult your financial advisor before taking any financial decision.


