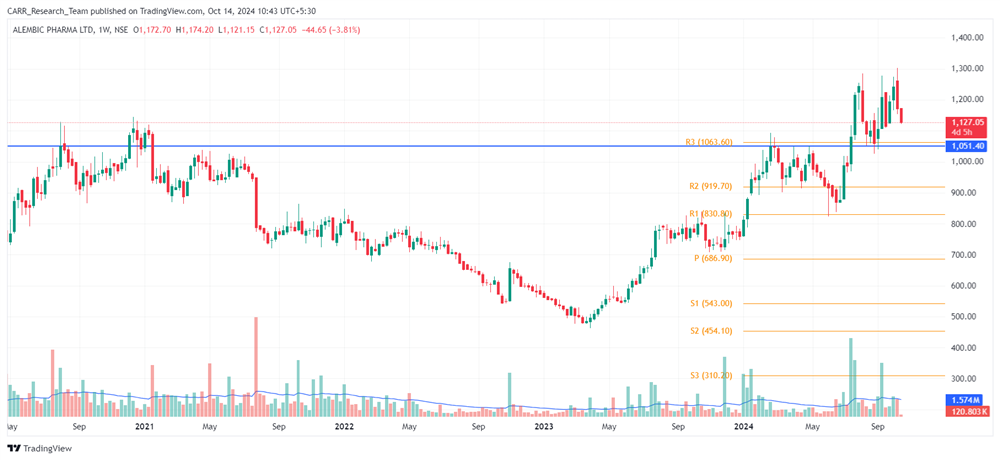
Stock name: Alembic Pharmaceuticals Ltd.
Pattern: Resistance breakout and retest
Time frame: Weekly
Observation:
Following the post-COVID market crash, the stock saw a strong upward movement and reached a new all-time high (ATH) in December 2020. It formed resistance around this level, with multiple failed attempts to close above it. In July 2024, the stock finally broke out with significant trading volume. After a retest and rebound with good volume, the stock is currently facing a second retest of the breakout level, showing weakened momentum. According to technical analysis, if the stock rebounds with strong momentum, it may see further upward movement. It's advisable to look for additional confirmations, such as RSI levels and the MACD indicator.

You may add this to your watch list to understand further price action.
Disclaimer: This analysis is purely for educational purpose and does not contain any recommendation. Please consult your financial advisor before taking any financial decision.
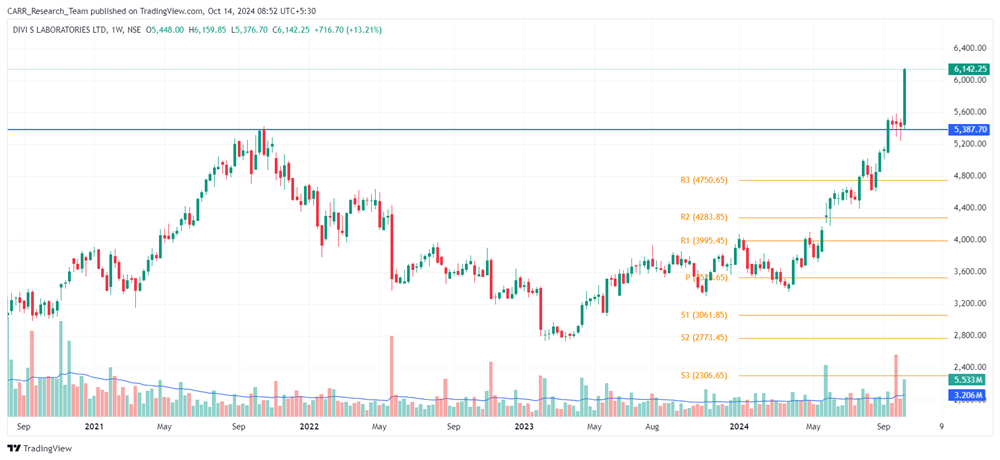
Stock name: Divi's Laboratories Ltd.
Pattern: Resistance breakout
Time frame: Weekly
Observation:
After reaching its previous all-time high (ATH) in October 2021, the stock declined until February 2023, then began to recover. In early September 2024, it surpassed its previous ATH on the weekly chart. After consolidating for a few weeks above the breakout line, the stock registered a large green candle with strong volume for the week starting on October 7. According to technical analysis, if the current momentum holds, the stock may continue to rise.Top of Form
Bottom of Form
It's advisable to look for additional confirmations, such as RSI levels and the MACD indicator.

You may add this to your watch list to understand further price action.
Disclaimer: This analysis is purely for educational purpose and does not contain any recommendation. Please consult your financial advisor before taking any financial decision.


