Just like Jay has Veeru, Munna Bhai has Circuit, and Bunny has Avi, even our chart patterns come in duos. Head & shoulder has Inverted head and shoulders, Double top has Double bottom similarly, Ascending Triangle has Descending triangle. We have already discussed the Ascending triangle in our previous blog. If you haven’t read it yet, click here. Now, let’s begin with understanding the Descending triangle pattern.
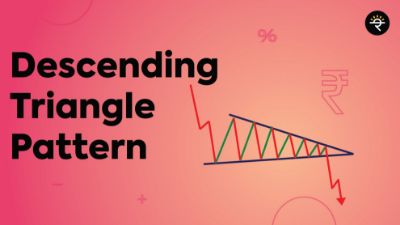
What is a Descending Triangle Pattern?The Descending Triangle pattern is a continuation pattern. I am sure you can recall what the continuation pattern means from the previous blog. It just means that the price will ideally continue moving in the same trend as before the consolidation. Since Descending triangle is a bearish formation, it is formed in an ongoing downtrend and the price continues to move downward after consolidating in this pattern. If this pattern is formed at the end of an uptrend, it may signal a bearish reversal.How is it formed?This pattern is formed with two lines. The first one is the support level from where the price keeps rebounding. The second line is formed by joining the lower highs in the price movement, making it a descending (Downward sloping) line. This complete formation appears to be like a triangle with a descending line and hence, it’s called a Descending Triangle pattern. Minimum two touchpoints are needed to make the support line and descending line valid.What does it tell you?Now, let’s have a look at the price movement in this pattern and understand what it indicates. We already know that the prior trend has been a downtrend for this pattern. After that, the price starts to consolidate. The price reaches the support level multiple times showing buying interest at this level. But whenever the price has bounced back up after testing the support it makes lower highs. These lower highs indicate that the sellers are fighting back to go beyond this support level. This whole scenario creates a bearish build up and eventually, there’s a breakdown at the support level, followed by continuation in the previous downtrend.What can be an ideal entry, price target and stop-loss?
For this pattern, one may take a short position (F&O) at the breakdown candle. The price target is calculated by taking the distance of the vertical line of the triangle and then adding it to the breakdown candle. Stop-loss can be placed at the recent high.
Example
Bottom line
As is the case of Ascending triangle, even Descending triangle may give false breakouts and/or longer consolidation duration. Hence, it is the best practice to get multiple confirmations from other indicators like MACD, RSI, etc. before entering into a position. If technical analysis intrigues you, make sure you click on the link to check out my course where I have explained more such patterns, indicators, and strategies in the most simplified way. Until next time!


