
Introduction:
In the vast landscape of technical analysis, patterns emerge as valuable tools for traders seeking to understand market movements and make informed decisions. Among these patterns, the cup and handle pattern stands out as a reliable indicator of potential bullish trends.
Imagine spotting a pattern that not only signals a potential buying opportunity but also provides insight into the psychology of market participants. That's precisely what the cup and handle pattern offers.
In this comprehensive blog, we will delve into the intricacies of the cup and handle pattern: what it is, how to identify it, and most importantly, how one can use it to their advantage in the dynamic world of stock trading.
Valid Pattern and its Relevance:
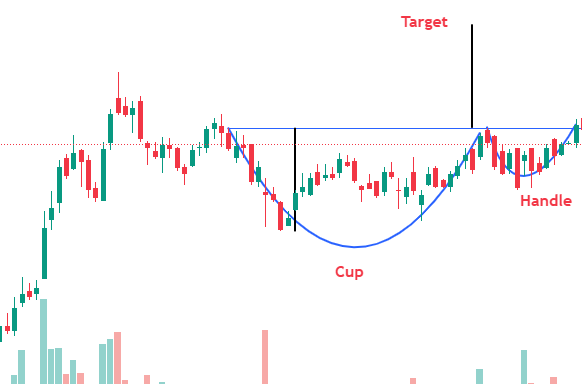
The Cup with Handle is a popular bullish continuation pattern that traders often use to identify potential buying opportunities. Developed by William O'Neil and introduced in his 1988 book, How to Make Money in Stocks, this pattern consists of two main parts—the cup and the handle.
The cup forms after a price advance and resembles a bowl or rounding bottom. Once the cup is formed, a trading range develops on the right-hand side, shaping the handle.
In simple terms, imagine a cup followed by a smaller cup-like formation called the handle.
This pattern indicates a consolidation period, and a breakout from the handle's trading range typically signals a continuation of the prior price advance.
Let's delve deeper into this powerful pattern and explore how you can use it to your advantage in the world of trading.
The above example is for educational purposes only.
The Cup with Handle pattern is a powerful tool for traders, signaling a bullish continuation in a stock's trend. Let's break down this pattern using some key points:
Trend: Before spotting the Cup with Handle pattern, look for an existing trend. Ideally, this trend should be a few months old. If it's too mature (say, more than a year), it means that there could be less potential upside.
Cup: The cup should resemble a "U" shape, like a bowl or rounding bottom. A "V" shape would be too sharp. The perfect pattern would have equal highs on both sides of the cup, but this isn't always the case.
Cup Depth: The depth of the cup ideally retraces 1/3 or less of the previous advance. However, with volatile markets, the retracement could range from 1/3 to 1/2. In extreme situations, it could even be 2/3, in line with Dow Theory.
Handle: After the cup forms, there's a pullback forming the handle. Sometimes it looks like the cloth of the flag or pennant sloping downward. The handle usually doesn't retrace more than 1/3 of the cup's advance.
Duration: The cup can form over one to six months, sometimes longer on weekly charts. The handle typically completed within one to four weeks.
Volume: Volume should decrease as prices decline and remain lower than average in the base of the bowl; it should then increase when the stock begins to make its move higher, back up to test the previous high.
Target: You can estimate the projected advance after the breakout by measuring the distance from the lowest point of the cup till the breakout point (neckline).
By understanding these simple rules, you can identify and trade the Cup with Handle pattern with confidence.

Conclusion:
Mastering the Cup with Handle pattern can significantly enhance your trading strategy. By identifying this bullish continuation pattern, traders can anticipate potential breakouts and capitalize on profitable opportunities. Remember to combine this pattern with other technical analysis tools for confirmation and always manage your risk.
With practice and patience, you'll be able to spot this pattern with ease and incorporate it into your trading routine. Stay disciplined, so that your “cup” can overflow with successful trades but just remember to “handle” your emotions as well.

