Chart patterns provide traders with valuable clues about potential price movements while doing technical analysis. One of the most reliable continuation patterns is the Cup and Handle formation. Understanding the Cup and Handle pattern can help you anticipate bullish breakouts and plan your entries with precision.
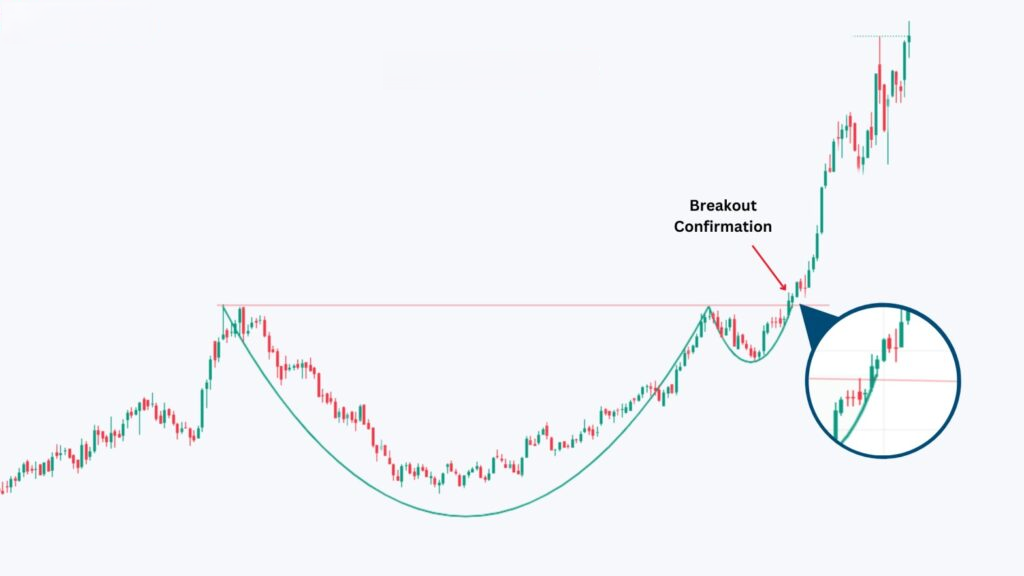
A Cup and Handle is a bullish chart pattern that resembles the shape of a tea cup. It usually appears after a strong uptrend, consolidates in the shape of a rounded bottom (the cup), and forms a smaller downward drift (the handle) before breaking out to new highs.
Anatomy of the Cup and Handle Pattern
Cup Formation: The cup resembles a “U” shape and signifies a period of consolidation after a bullish trend. The price gradually declines and then rises back to the previous high, forming a rounded base. This shows that selling pressure has diminished, and buyers are gradually regaining control.
Handle Formation: Once the cup is complete, a slight pullback forms the handle. This usually appears as a downward or sideways drift, often contained within a small descending channel or wedge. The handle is a final shakeout before the breakout.
Breakout: A breakout occurs when the price closes above the resistance formed at the top of the cup on increased volume. This confirms the pattern and typically leads to a renewed bullish move.
How to Trade the Cup and Handle Pattern
Entry Point
- Enter the trade when the price breaks above the handle’s resistance line on strong volume.
- A high-quality breakout typically involves a decisive close above the resistance (not just a wick) and ideally comes with volume confirmation.
- Conservative traders may choose to wait for a confirmation candle above the resistance to reduce the risk of a false breakout. For them another way can be to enter 50% of your quantity at breakout and 50% after a confirmation candle.
Target Price
There are a couple of standard methods to project your profit target:
Chart-Based Target:
- Measure the depth of the cup (from the bottom to the resistance level).
- Add this height to the breakout point.
Target = Breakout Level + (Resistance - Cup Low)
Fibonacci Extension or Pivot Points: These tools can also be used to estimate logical resistance levels or profit-taking zones above the breakout.

Stop-Loss Placement
- Place your stop-loss below the handle’s low to protect against failed breakouts.
- A more aggressive stop could be just below the breakout candle’s low for tighter risk control.
- Avoid placing stops too close, especially if the handle formed on low volume, as minor whipsaws are common.
Additional Tips
- Ensure the cup has a rounded bottom rather than a sharp V-shape — this signals healthier accumulation.
- The longer the cup formation, the more significant the breakout tends to be.
- Use supporting indicators like volume surge, RSI breakout, or MACD crossover to confirm momentum.
- These patterns are more reliable in bullish market conditions or strong sectors.
Charting Exercise: Switch to a daily chart and start scanning for Cup and Handle formations. Clearly mark:
· Cup bottom and rim (resistance)
· Handle structure (a small “U” or descending channel or wedge)
· Potential Breakout, Entry, Stop-loss, and Target zones
Use chart tools to draw the neckline of the cup and the upper boundary of the handle. Measure the depth of the cup to estimate your target price after breakout. Watch for volume confirmation to validate the breakout.
Homework
Look at the following stocks and identify which one shows signs of a developing or confirmed Cup and Handle pattern:
1. Sapphire Foods India Ltd. (SAPPHIRE)
2. Shyam Metalics and Energy Ltd. (SHYAMMETL)
Study the price action, draw the cup and handle zones, and see if the breakout is supported by volume.
You may also add the stock to your watch list to understand further price action.
Disclaimer: This analysis is purely for educational purpose and does not contain any recommendation. Please consult your financial advisor before taking any financial decision.