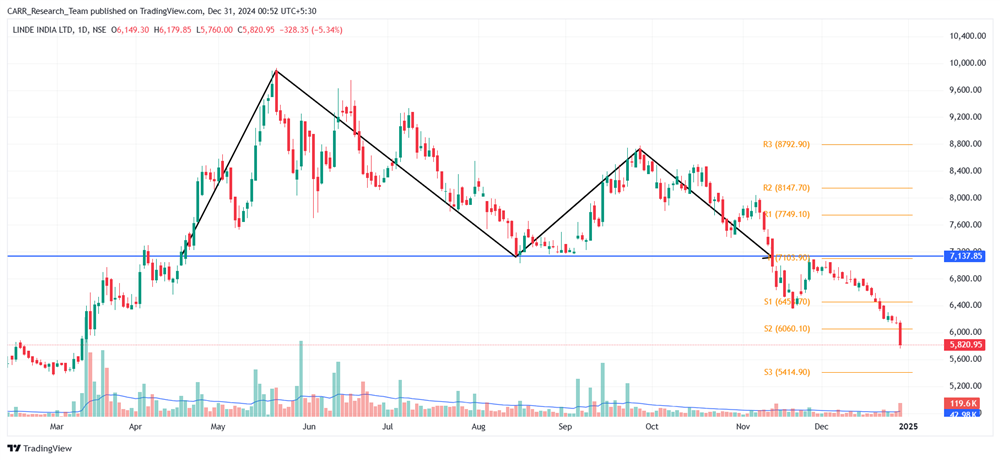
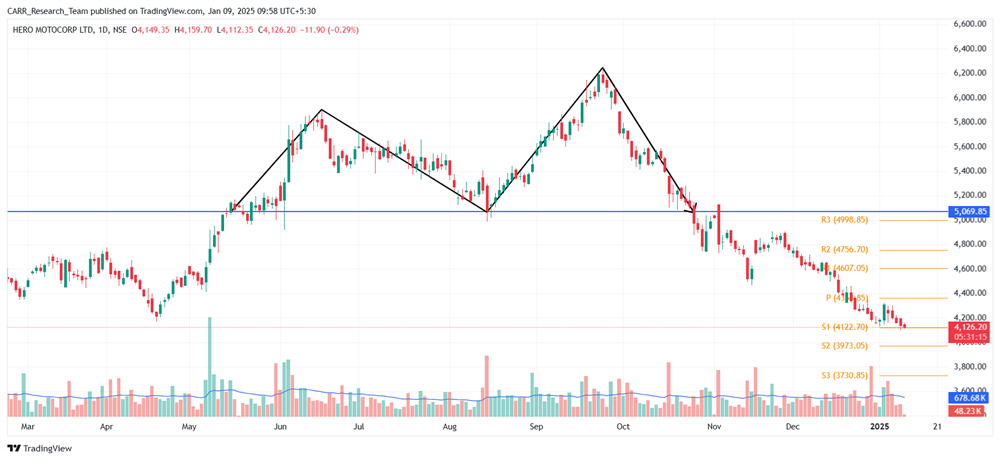
Stock name: Hero MotoCorp Ltd.
Pattern: Double top pattern
Time frame: Daily
Observation:
As highlighted in our previous blog on November 12, 2024 (link for reference), the stock had formed a double top pattern on its daily chart. Following a breakdown and retest, it resumed its downward trajectory from November 4, 2024, ultimately achieving the target projected by the technical pattern. The stock is now trading at a critical support level, making its next movement an important development to watch.
You may add this to your watch list to understand further price action.
Disclaimer: This analysis is purely for educational purpose and does not contain any recommendation. Please consult your financial advisor before taking any financial decision.

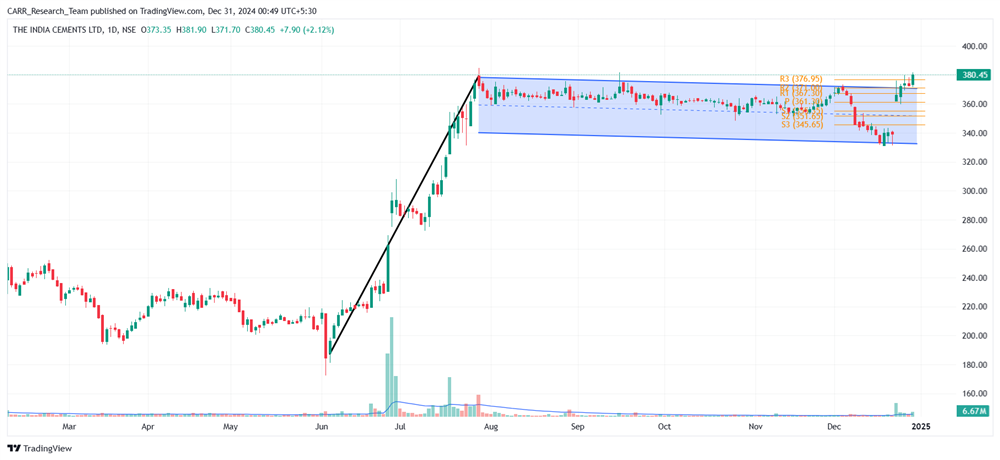
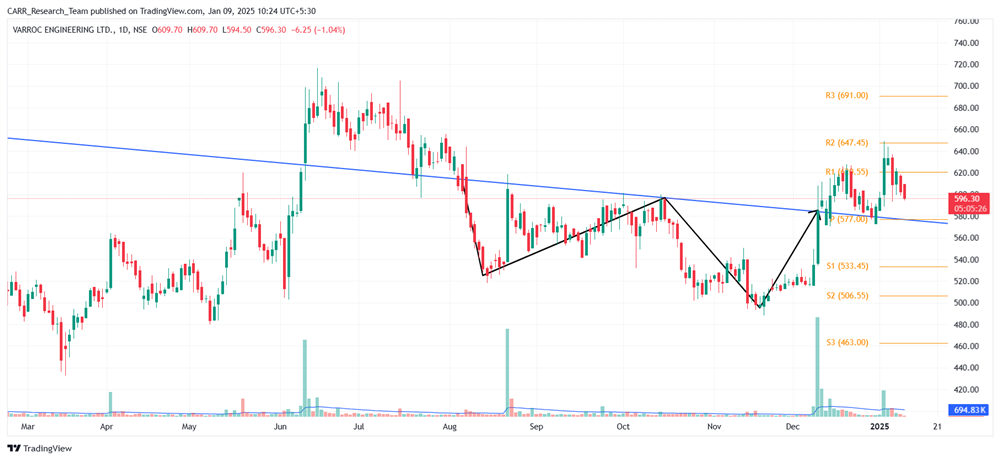
Stock name: Varroc Engineering Ltd.
Pattern: Double bottom pattern and retest
Time frame: Daily
Observation:
Since June 2024, the stock has been in a downtrend. Between August and December 2024, it formed a double bottom on the daily chart and broke out of the pattern on December 10, 2024, with strong volumes and upward momentum. Shortly after, the stock retested the breakout level but rebounded by late December. On January 2, 2025, it formed a green candle with significant volumes, suggesting that maintaining the rebound momentum may lead to further gains. It's advisable to look for additional confirmations, such as RSI levels and the MACD indicator.
You may add this to your watch list to understand further price action.
Disclaimer: This analysis is purely for educational purpose and does not contain any recommendation. Please consult your financial advisor before taking any financial decision.