Filter
RSS

Blog

Reliance Retail Segments Review

Company Background:


  • Reliance Retail Limited founded in 2006 is a subsidiary of Reliance Industries Limited.
  • The fastest-growing retailer in the world.
  • India’s largest cash and carry chain with 52 stores and more than 4 million registered B2B and B2C customers
  • India’s largest consumer electronics retail chain with 8,249 stores
  • India’s largest fashion destination with 777 stores of Reliance Trends


Business Segments:

As per above infographic Reliance Retail is majorly in the 5 segments:

1) Grocery

2) Connectivity

3) Fashion & Lifestyle

4) Consumer Electronics

5) Petro Retail


The relation between contribution and market growth of the business segments:

To analyze and estimate the future growth of the entity one should focus on major segments of the business of the entity. Not just segmentation, but how much individual segments are contributing to the entire revenue of the entity and the future prospects of those segments can be considered. 

Along with economic conditions, one of the factors to be considered is the growth of the segment in the market and whether the contribution of the segments is in line with the expected growth of respective segments. 

For Example – In case of Reliance Retail, Grocery segment of the entity contributes 21% of the total revenue of the entity and the market growth rate of the segment is around 48%, Connectivity segment is contributing around 34% of the total revenue and the segment is growing at 28%. 

If one considers these facts for all the segments and relates to the current economic situations, the expected growth of the segments – strength and opportunities of the business can be estimated to a certain extent. 

Due to the COVID-19 situation, the savings of the general public has gone down to a certain extent as well as other financial stress has affected which can have a good impact in short term over the fashion and lifestyle segment of the entity.


Conclusion:

Understanding of business segments and its relation with the economic conditions is one of the most important things for consideration while investment decision.

Reliance Retail Segments Review
Read More
Investing in Gold

Options for investment in gold:


  1. Physical Gold
    1. Jewelry
    2. Coins
    3. Gold Savings Schemes
  2. Paper Gold
    1. Sovereign Gold Bonds [SGBs]
    2. Gold Exchange Traded Funds [ETFs]
    3. Digital Gold [Mobile wallet platforms like Paytm, GoldRush, etc.]


Gold Market Cycle:

The gold market cycle means the period in which the instrument is in the bull run. Simply, it’s the period from the start point of the bull run to the correction start point. Usually, the gold market cycle lasts for around 8 to 10 years. 

For example – the previous gold market bull cycle was started in 2001 and ended in 2011. In 2001 – [In 2001 approx. per gram price was approx. Rs. 400 & in 2012 it was approx. Rs. 3,112. After this high, it corrected up to Rs. 2,227 in the next 3 years i.e. July 2015]. 

According to Experts, currently gold is in a bull market cycle. So, if one checks the below graph, approx. from 2017, the gold entered in the bull run cycle with approx. per gram price of Rs. 2,523 and as on date gold is at around Rs. 5,230. If the usual bull cycle horizon matches with the current gold market cycle, even if in the short term, gold is in an overbought zone, one can see a good amount of growth in the remaining life cycle. 

According to US-based analyst Nigam Arora, the author of The Arora Expert, “ there is more than 50% probability of gold approaching $3000 in this gold market cycle.” Earlier, Christopher Wood had said in his Greed and Fear report that gold could climb up to $4000 in the current bull cycle. [Current Price as at 6th August 2020 is approx. US$2,060.70, Mumbai – Rs. 5,768 per gram].

Returns comparison with other investment options:

If one compares the returns on major investment options for retail investors i.e. Fixed Deposit, SENSEX, NIFTY, Gold at last 20 years CAGR, Gold has provided the highest rate of return at approx.. 13% of CAGR.[Refer https://www.rachanaranade.com/blog/investment-comparison]

Investing in Gold
Read More
Parameters to analyze IT Companies

Many investors keep a keen interest to invest in IT companies as they fall in the defensive category, meaning when all sectors are down, the IT sector is generally up. Also, since IT companies have global businesses, they are not only dependent on the domestic market i.e. India forms the view-point of diversification. 

So before investing in IT companies, let’s look at some of the important key ratios.

1. Operating Profit Margins (OPM). 

An Investor should focus at Operating Profit Margin of IT companies, because in the Service sector, especially IT companies, employee cost is the major cost. Below is the chart of the last 3 year’s OPM of Top 5 IT companies based on their market capitalization.

2. Return on Equity (ROE): 

ROE is a very important ratio to analyse for IT companies since it reflects the profit created for shareholders by reinvesting in its business. It is also said that it is profit on the shareholder’s capital on the balance sheet date. ROE should always be higher, otherwise investing in low ROE businesses will wipe out the investor’s wealth. Below is the chart of ROE generated over the last 10 years by these 5 major IT companies.

One of the key reasons to invest in IT companies: 

Since IT companies have global businesses, they get the advantage of depreciating Indian Rupee, which in turn increases profits and thereby enhancing their reserves (profits kept aside) year on year. IT companies distribute a good portion of earnings through a dividend to the shareholders. IT companies are also known as cash-rich businesses. They enhance shareholder’s wealth through buy-backs or dividends. Just look at the dividend payout ratio for the past 3 years of these Top 5 IT companies below.

Parameters to analyze IT Companies
Read More
Experience Timeline of Infosys Limited

What is Experience Timeline?

Experience Timeline is a visual presentation of a sequence of events, especially historical events which eventually indicates the experience of the entity.

Why Experience Timeline?

Since it indicates the experience of the entity based on which one understands how the company is growing operationally and strategically. Understanding of the entity’s operational and strategic movements is one of the important factors of consideration while performing fundamental analysis of the entity.

About Infosys Limited:

Infosys is a global leader in next-generation digital services and consulting. It enables clients in 46 countries to navigate their digital transformation.

With nearly four decades of experience in managing the systems and workings of global enterprises, it expertly steers their clients through their digital journey. They do it by enabling the enterprise with an AI-powered core that helps prioritize the execution of change. It also empowers the business with agile digital at scale to deliver unprecedented levels of performance and customer delight. Their always-on learning agenda drives their continuous improvement through building and transferring digital skills, expertise, and ideas from their innovation ecosystem.

Experience Timeline of Infosys:

Infosys was established in 1981 by Mr. Narayana Murthy and 6 engineers in Pune. It was listed on NSE and NASDAQ in 1995 and 1999 respectively. The major landmark of Revenue of US$ 1 Bn. achieved by the entity in 2004 – within 24 years of establishment. Along with such landmarks, the entity acquired many global entities in this industry to expand the entity at a global level.

Conclusion:

Understanding of operational and strategic experience is one of the important points in fundamental analysis of the entity along with other operational and financial review points.

 
Experience Timeline of Infosys Limited
Read More
Parameters to analyze Banks

Since the COVID-19 pandemic and global meltdown in stock markets, the whole Indian banking sector has underperformed due to fear of NPA. Even, RBI mandated banks to make COVID-19 related provisions in their books and instructed them to not declare any dividend till the end of September month. Before investing in banks, investors need to watch out for some of the key ratios, we have taken the top 5 banks as our examples based on market capitalization. Below are some of the important parameters to watch out for:

1. On the basis of Liquidity of Banks - Capital Adequacy Ratio:

Capital Adequacy Ratio (CAR) is simply the core capital of the bank. CAR is measured based on Tier-1 capital and Tier 2 capital. Tier 1 capital is such a capital where a bank can absorb the losses without disturbing normal business operations. Thus, it provides a liquidity cushion to the bank and it also protects the depositors. Tier 2 capital is such a capital where the bank can absorb the losses in the event of bankruptcy of a bank, it provides lesser protection to the depositors. Banks are required to maintain a minimum CAR of 10.5% including a Capital Conservation Buffer of 2.5% as per Basel III norms.


2. On the basis of Asset Quality:

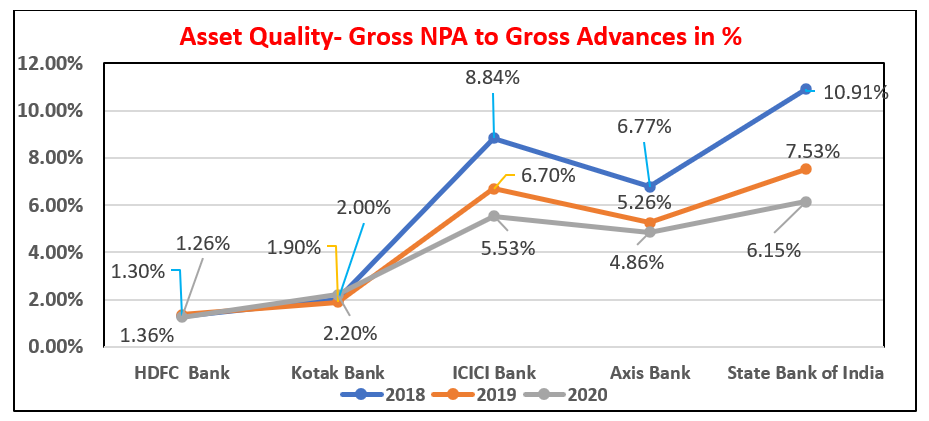
Bank’s asset quality matter’s the most, higher the NPA ratio, the worst the case, NPA’s ultimately wipe out the capital of the bank, thus impacting the CAR ratio.NPA means the default of interest and the principal amount by the borrower. As per RBI, banks classify a borrower’s account as NPA when the interest due on the loan is not paid within 90 days. Investors need to analyze both Gross and Net NPA ratios Gross Non-Performing Assets as a % of Gross Advances (GNPA): GNPA is the sum of all the types of unpaid loans by the borrowers.
Net Non-Performing Assets as a % of Net Advances (NNPA): NNPA is the sum of unpaid loans less the provision made for these bad loans.

3. On the basis of Profitability:

One of the key profitability ratios to watch out for is Net interest Margin- NIM. Since the bank’s business model is to raise funds from depositors and lend it to individuals and businesses, it receives interest on an amount lent and pays interest on the funds raised via various routes. Thus, the difference between interest earned and interest expended over its average earning assets is called net interest earned, it is popularly expressed in % form and is popularly known as NIM.

Parameters to analyze Banks
Read More
 Parameters to analyze Top 3 Insurance Companies

In living life, everything that the person is worried about losing tries to ensure that by something. Insurance companies are the one who provides such risk management to individuals, businesses, and institutional clients. This is done through various types of insurance products that customers look for i.e. life insurance, health or medical insurance, car insurance, etc. The basic principle of all such products remains the same that the insurer guarantees payment or reimbursement in the event of losses for the insured. From an investor’s perspective, investing in certain kinds of insurance companies like life insurance may appear risky as these businesses consist of long-term products and services, and also require high initial acquisition cost. 

Therefore, while analyzing such companies’ certain business growth parameters need to be considered over the years and margins. We have covered in this blog such 3 parameters for the top 3 life insurance companies in India to take you through their short analysis to understand and compare these companies with each other. We have selected these top 3 companies based on the market capitalization as of 26th November 2020.

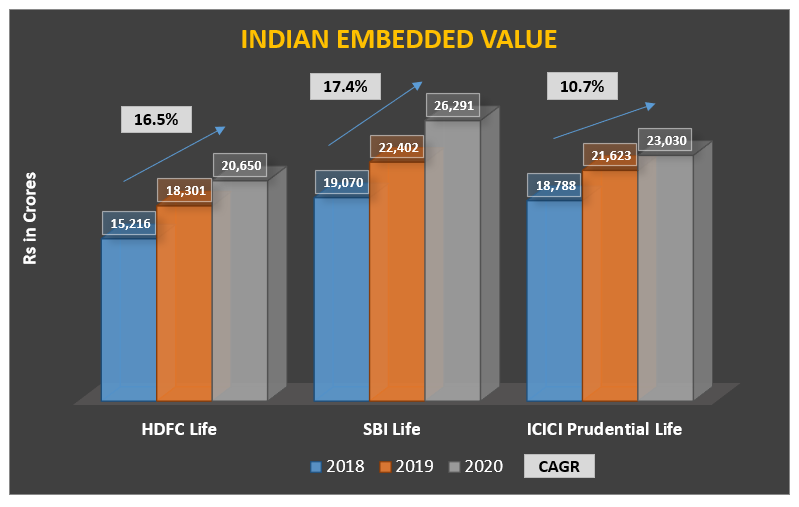
Embeded Value [EV]

This is the measure of the value of the life insurance company. This measure indicates the expected profitability from the current underwritten policies and current net worth. The embedded value of the company is calculated as the sum of adjusted net worth and the discounted value of profits from in-force policies.
Below is the comparison of the embedded value of the top 3 insurance companies:

New Business Premiums [NBP]

As the name indicates, this is the value of premium acquired by the entity from new policies for a particular year. So, the premium earned from the new contracts in a given financial year is referred to as the new business premium for an insurance company. Very natural to understand, if the company is able to grow at a higher rate with NBP, the business perspectives seem to be on the high good side.

Below is the comparison of NBP for the top 3 life insurance companies:

New Business Margin [NBM]  
This is a measure of profit margin used by the insurance companies for the new business received during a particular financial year. NBM is the ratio of the value of the new business to the present value of premium income. It is calculated by dividing the profit on the new business by the present value of the new business or Embedded value.

Conclusion:

Based on the above analysis, one can compare these parameters for the top 3 life insurance companies and understand the fundamental analysis of such companies. Rather, these are not the only parameters to be considered for investment decision making, so consideration of other factors along with these is important.


Parameters to analyze Top 3 Insurance Companies
Read More